How to read a flood extent map without a GIS background
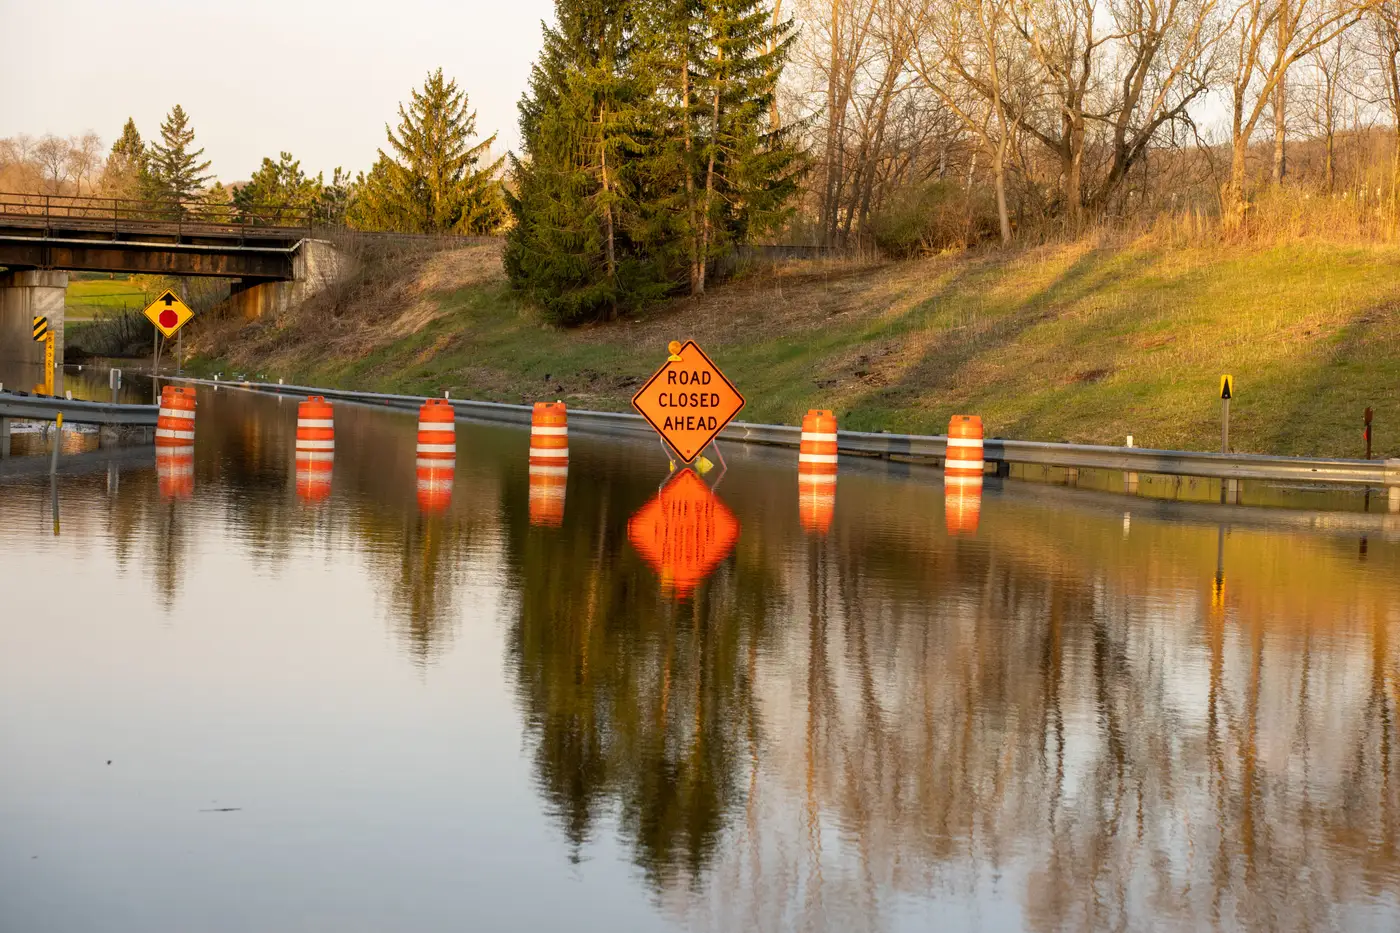
You get handed a flood extent map at 3am and the GIS liaison is off shift. Here's what the shapes and colors mean, so you can brief the watch commander in two minutes instead of waiting for someone to translate a legend for you.
What the polygon on the map shows
A flood extent map is built from one or more shaded shapes, called polygons, laid over a base map of your district. Each polygon marks an area where the imagery showed standing water at the moment the satellite or aircraft passed overhead. That's it. The polygon is a snapshot, taken at one point in time. If a levee gives way ten minutes after that pass, the new water won't be on the map yet.
The outline of the polygon is the part that matters for routing decisions. Where the line crosses a road, that road is wet at whatever resolution the sensor can see, usually somewhere between a few meters and a few tens of meters per pixel. A polygon edge that tracks a field boundary and happens to follow a drainage ditch is probably real water sitting in the ditch, not a tracing mistake.
Reading the legend without a cartography class
Most flood extent legends come down to three or four entries:
- A filled color, often blue or teal, for standing water
- A hatched or lighter shade for areas the sensor couldn't see clearly, usually cloud or tree canopy
- A boundary line marking your area of interest, the district or watershed you asked to be mapped
- A timestamp
Check the timestamp before anything else on the page. If the map is stamped mid-morning and you're briefing at noon, the water you're looking at could already be several hours out of date, and in a fast-rising event that gap matters more than any other detail on the page. State the age of the map out loud every time you pass it to the next person in the room, the same way you'd flag a stale radio check.
Standing water polygons versus flood risk layers
Don't confuse a standing water polygon with a flood risk or floodplain layer, the kind the planning department pulls for zoning work. A risk layer shows where water could go, built from modeling and historic data. A standing water polygon shows where water actually was, observed, during a specific pass. For response coordination you want the observed layer. For long-range planning you want the modeled one. The two look alike on a shared screen in a crowded EOC, so say which one you're holding when you hand it off.
What the map can't tell you
The polygon gives you extent, not depth. A road shaded blue could be under two inches of sheet flow or four feet of moving current, and the shape alone won't tell you which. It also won't say which structures are occupied, which culverts are blocked, or whether the water is still rising. Treat it as one input alongside the ground reports and gauge data you already trust, not a replacement for either.
Cloud cover sets the other limit worth knowing. Optical satellite imagery needs a clear look at the ground to resolve water. When the pass lands during an active storm system, parts of your district can come back marked as no-data rather than wet or dry. That's the sensor losing its line of sight, not an error in the processing.
Handing it off at shift change
If one thing from this sticks, make it the timestamp and the no-data category in the legend. A duty officer who can say "this extent is four hours old and covers about eighty percent of the district, the rest was under cloud" has given the incoming shift more than a GIS background would have added on its own. The shapes do the rest of the work, as long as someone reads them out loud.
If you're standing up a flood response right now and need that first extent map without waiting on an analyst to delineate it by hand, Rapid Flood Mapping turns the next cloud-free pass over your area into a numbered situation brief.