Standing water extent vs. flood depth: what a flood map shows
During a flood response, someone on your team will ask how deep it is at a given intersection, and you'll have to explain that the map you just handed them doesn't answer that question. This comes up on nearly every event, so it's worth being precise about the terms before the sitrep goes out.
Extent is where, depth is how much
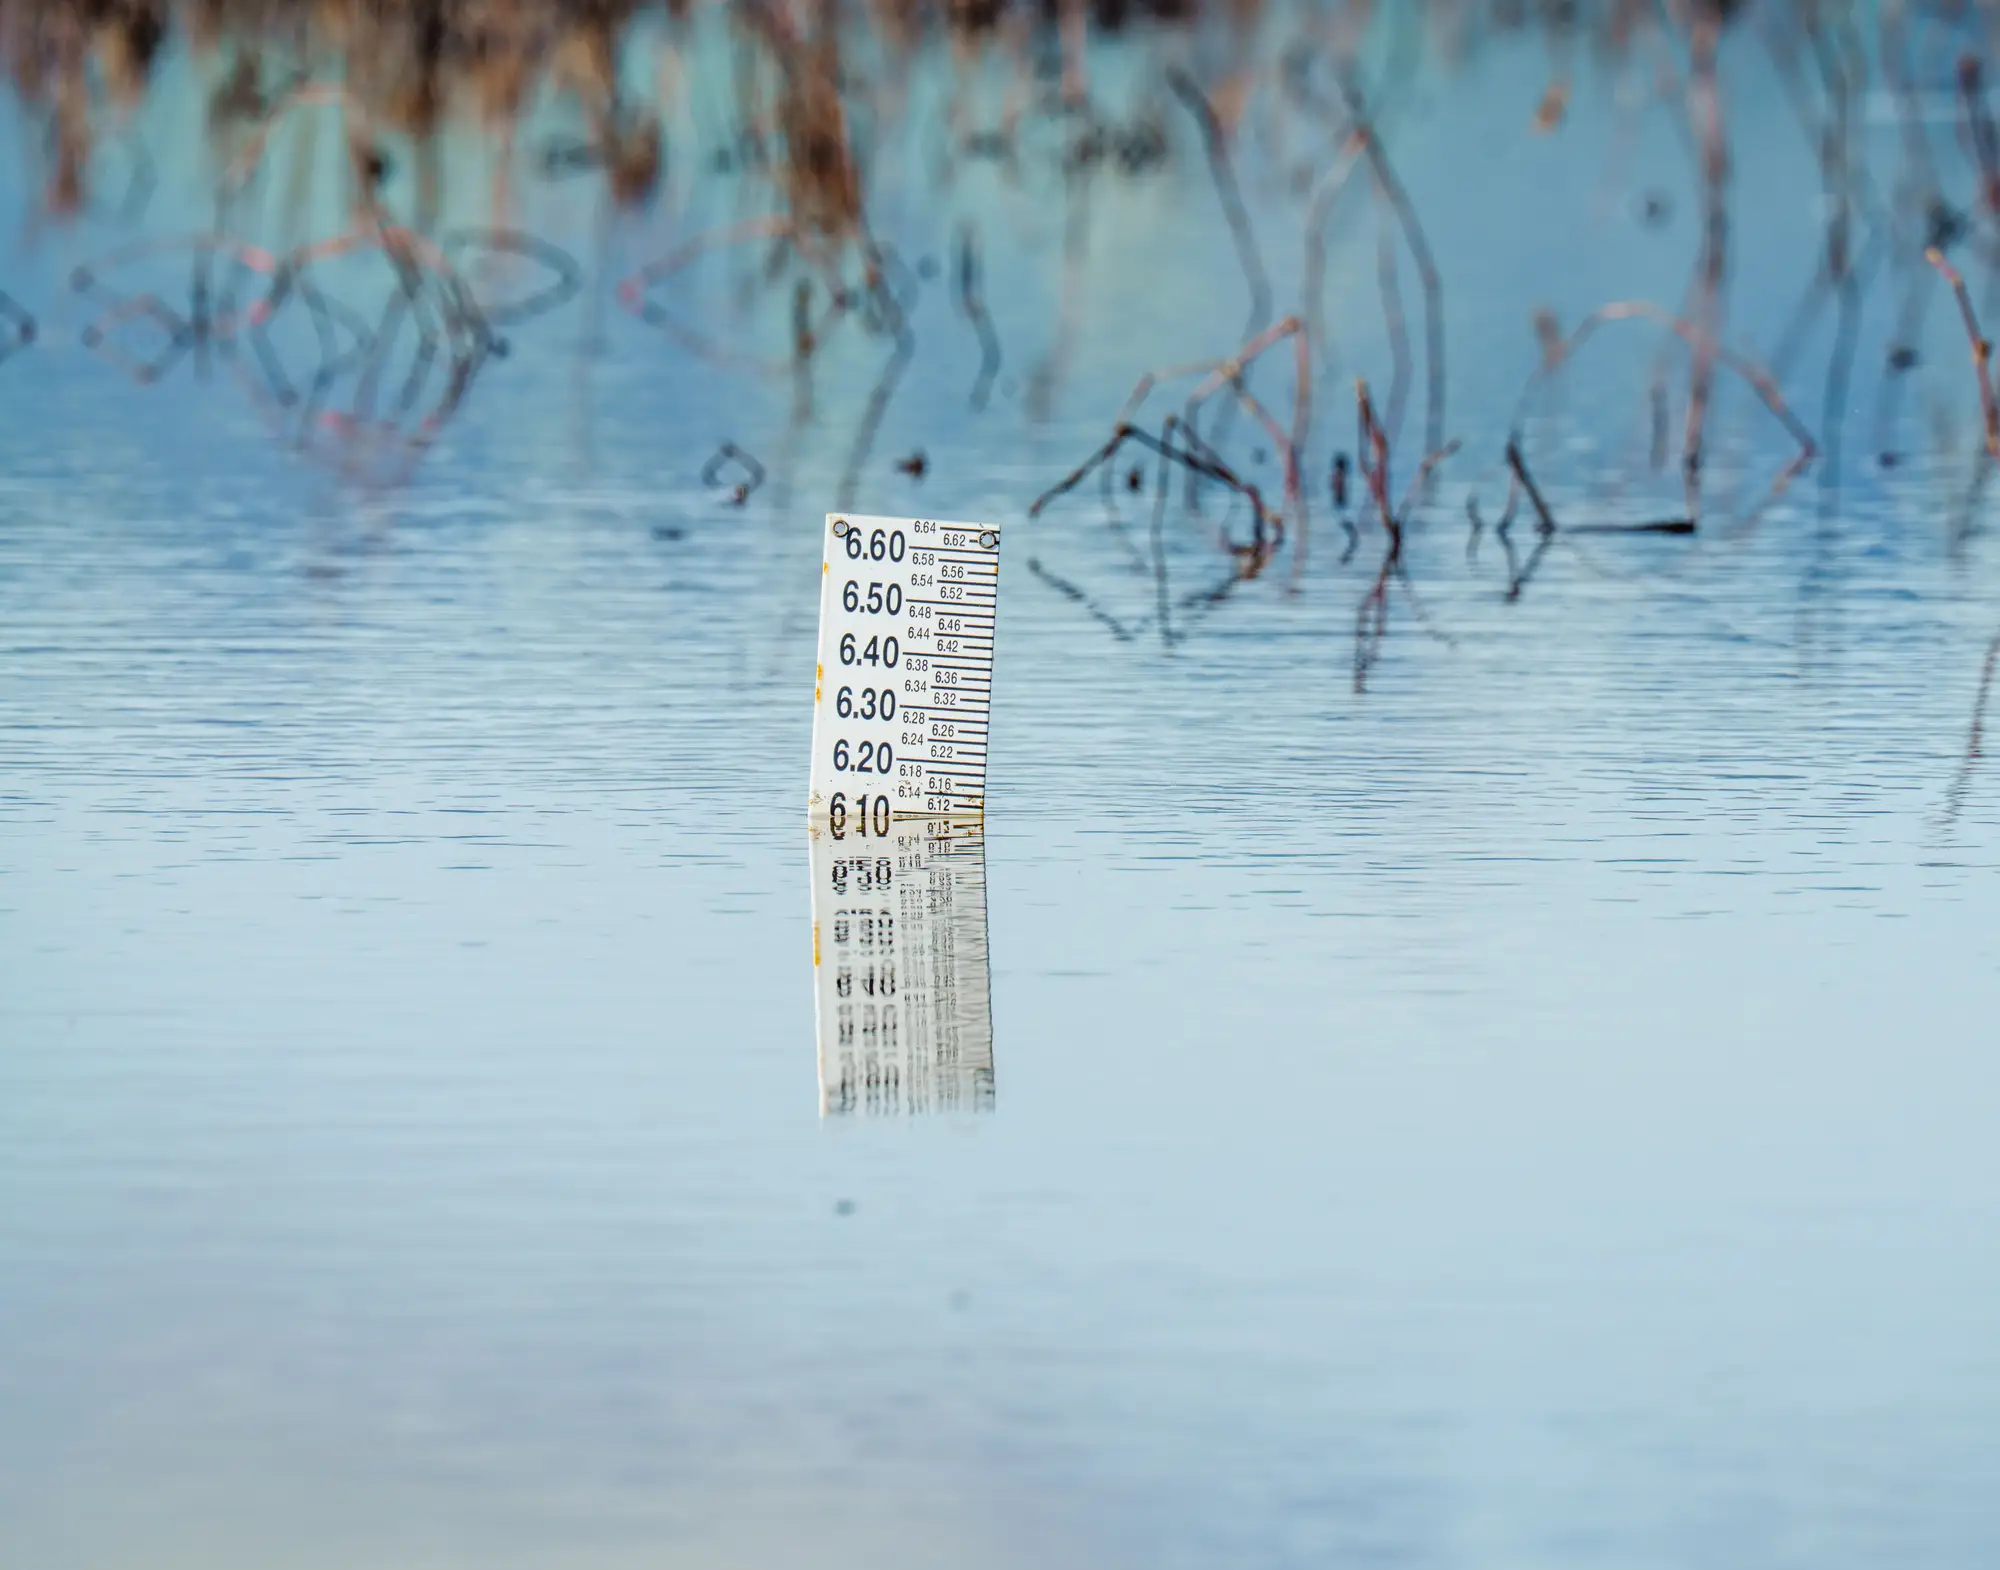
Standing water extent is the footprint: the boundary of water on the ground at the moment an image was captured. It's a shape, a line showing where there's water and where there isn't right now. Depth is a different measurement entirely. It's water height above the ground surface, usually in meters or feet, and it doesn't come from satellite imagery at all.
A multispectral satellite pass can pick up standing water pretty reliably. Water reflects light differently than wet grass or dry pavement, and that contrast is what lets you draw the extent line. But that same pixel doesn't tell you if the water sitting there is four inches deep or four feet deep. The sensor sees a wet pixel or a dry pixel. It doesn't measure down.
Depth comes from somewhere else: river gauges, hydraulic models tied to a digital elevation model, or a crew wading out with a stick and taking a reading. None of that comes bundled with an overhead look at the affected area.
Inundation extent, flood extent, standing water extent
You'll see all three terms used interchangeably in sitreps, FEMA products, and flood hydrology papers. They mean the same thing: the boundary of water coverage over land at a point in time. If a report or a vendor uses one term and not another, don't assume they're describing something different. They're almost certainly describing the same kind of output, a shape showing where water currently sits.
What a flood extent map does and doesn't show
What it shows: the area under standing water as of the most recent cloud-free pass. That's enough for a specific set of calls. Which neighborhoods need door-to-door checks. Which access roads are likely cut. Roughly how far the water has spread since the last look, if you've got two passes to compare. Where to send a ground team to verify conditions before you commit more resources.
What it doesn't show: how deep the water is at any point, whether it's rising or already receding, what's underneath it (a flooded field reads the same as a flooded parking lot from overhead), or water hidden under tree canopy or cloud at the time of the pass. It won't give you flow velocity or structural risk to a specific building either. That's a job for engineers and hydrologists working from ground instruments, not from a satellite image.
This matters because a flood extent map sometimes gets handed over and treated as a complete picture. It isn't one, and it was never built to be. It answers one question fast: where is the water right now. Pair it with gauge readings and ground reports and you've got depth and trend. Use it on its own and you've still got extent and rough timing, which is enough to start routing resources and briefing command before the fuller picture arrives.
Why the distinction matters in a sitrep
When extent and depth get blurred together, people start reading a shaded polygon as "flooded to the roofline" when it might mean two inches of water across a lot. Being exact about what the map actually measures keeps expectations lined up with what ground teams find when they arrive, and keeps you from over- or understating the situation to command.
If you need the extent piece fast, as soon as there's a usable satellite look over the affected area, Rapid Flood Mapping turns it into a numbered situation brief you can hand straight to response coordination, no depth claims, just where the water is right now. Reach out when you're standing up a response and need that first look.